Vehicle Emissions Remote Sensing
The Complete Reference Guide
Vehicle emissions remote sensing is a non-intrusive roadside technology used to measure the exhaust emissions of vehicles as they drive under real-world conditions. Instead of bringing vehicles into a laboratory or installing equipment on board, a Remote Sensing Device measures the exhaust plume from the roadside in less than a second.
The technology uses infrared and ultraviolet spectroscopy to detect pollutants such as carbon monoxide, hydrocarbons, nitric oxide, nitrogen dioxide, ammonia and carbon dioxide, together with optical indicators related to smoke or particulate emissions. By combining emissions data with vehicle speed, acceleration, license plate information, ambient conditions and vehicle technical data, remote sensing makes it possible to understand how vehicles actually perform on the road.
Remote sensing is used by governments, researchers, inspection programs and cities to identify high-emitting vehicles, evaluate real-world emissions, support enforcement, assess low-emission policies and monitor fleet emissions at scale.
This guide was created to provide a complete and scientifically rigorous introduction to vehicle emissions remote sensing, covering its physical principles, historical evolution, technological capabilities and limitations and useful resources about the technology and its applications. The objective is to bring together, in a single continuously updated reference, the knowledge that is currently scattered across scientific publications, technical reports and regulatory documents.
GRANTED PROJECTS
1. What is Vehicle Emissions Remote Sensing?
Vehicle emissions remote sensing is a method for measuring the gases emitted by vehicles as they are being driven on real roads, under real traffic conditions, without interfering with the driver or the vehicle itself.
A Remote Sensing Device (RSD) projects a beam of light across the road and analyzes how the exhaust plume from a passing vehicle absorbs that light. Because different gases absorb light at different wavelengths, the system can determine which pollutants are present and estimate their concentration in the exhaust plume by applying optical spectroscopy.
The remote measurement takes place in less than a second. When a vehicle drives through the sensing zone, the system automatically triggers a measurement. The system records emissions from the exhaust plume of gases and captures additional information, such as vehicle’s speed and acceleration, ambient conditions and vehicle identification data.
Unlike laboratory testing, remote sensing does not require vehicles to be brought into a controlled facility. Unlike portable onboard instruments, it does not require equipment to be installed in the vehicle. The sensor simply audits vehicle emissions non-intrusively, under real-world driving conditions. The entire sensing process is automatic and non-contact. Drivers usually do not even notice the measurement taking place.
Over the last three decades, remote sensing has evolved from an experimental research technique into a mature tool used in legal inspection and maintenance programs, air quality studies, fleet screening applications and policy support. Today, millions of remote emissions measurements are performed every year on vehicles driving around the world.
How Remote Sensing Differs from Laboratory Testing
To understand why remote sensing has become important, it is necessary to understand the limitations of traditional emissions testing. For decades, vehicle emissions certification was based primarily on laboratory measurements. Vehicles were placed on dynamometers and driven through standardized driving cycles while emissions were measured with high precision instruments. Laboratory testing remains essential. It provides repeatability, control and regulatory consistency. Without laboratory procedures, modern emissions standards would not exist.
However, laboratory conditions can never fully reproduce the complexity of real traffic, particularly because vehicles age differently and maintenance conditions vary enormously. As a result, vehicles that perform well during laboratory certification may behave very differently on the road.
Remote sensing was developed partly to bridge this gap.
Instead of measuring a few vehicles under controlled conditions, it measures large numbers of vehicles in actual operation. This makes it possible to observe how emissions behave across entire fleets under realistic driving conditions.
Remote Sensing vs PEMS
Another important instrument that can measure vehicle emissions is called “PEMS” – Portable Emissions Measurement Systems. PEMS instruments are installed directly on a vehicle (i.e. inside the trunk) and continuously measure exhaust emissions while the vehicle is driven on the road.
These systems are advanced on-board laboratory stations installed on the vehicles. They are extremely powerful because they provide second-by-second emissions data over entire trips and are now widely used in regulatory testing and real driving emissions procedures.
However, PEMS also has essential limitations:
- instrumentation needs to be mounted on the tested vehicle,
- installation is complex and equipment is expensive,
- only small numbers of vehicles can be measured by unit of time and drivers are aware that the vehicle is being tested.
Thus, PEMS is great for type-approval testing, but not feasible to analyze real-world vehicle emissions.
Remote sensing takes a different approach. Instead of collecting continuous data from one vehicle, it collects instantaneous measurements from thousands or even millions of vehicles.
The two methods are therefore complementary rather than competing. PEMS provides depth. Remote sensing provides scale.
Vehicle emissions remote sensing complements laboratory testing, PEMS, OBD, PTI/I&M and air-quality monitoring rather than replacing them.
2. Why Real-World Emissions Matter
One of the most important lessons in modern vehicle emissions research is that laboratory emissions and real-world emissions are not always the same. This became particularly evident during the 1990s and 2000s as remote sensing programs expanded internationally. Researchers repeatedly observed that some vehicle categories emitted far more pollutants on the road than expected from certification data. Vehicles that appeared compliant during certification testing sometimes produced several times higher emissions under actual driving conditions. Remote sensing revealed this problem, and once the data became impossible to ignore, the automotive and regulatory landscape began to change.
Defeat Devices and the Dieselgate Turning Point
The importance of real-world measurements became globally visible during the Dieselgate scandal in 2015. Investigations revealed that some vehicles had been programmed to recognize laboratory testing conditions and temporarily activate stronger emissions controls during certification procedures.
Outside the laboratory, emissions could increase substantially.
Although remote sensing was not the only technology involved in uncovering these discrepancies, decades of remote sensing data had already shown that real-world NOx emissions from certain diesel vehicles in the USA were consistently much higher than expected.
The scandal accelerated a major shift in emissions regulation worldwide, with greater emphasis on real-driving emissions, increased interest in in-service surveillance and renewed attention to independent real-world monitoring technologies.
Remote sensing became part of a much larger movement toward understanding what vehicles actually emit outside controlled environments.
The Role of High Emitters
Vehicle emissions are not evenly distributed across fleets. In many cities, a relatively small number of vehicles are responsible for a disproportionately large share of pollution.
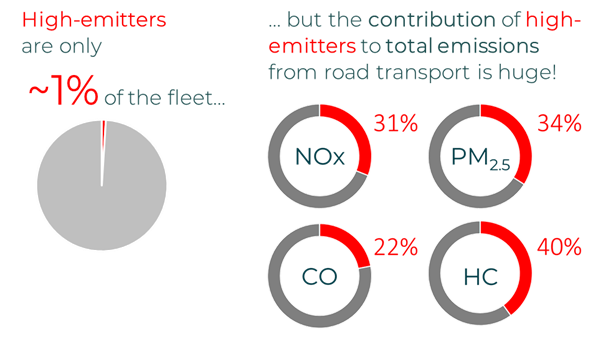
These are often called high emitters or super-emitters and may result from broken engines, failed aftertreatment systems, tampering, or poor maintenance over time. Remote sensing is uniquely capable of detecting these outliers in real traffic conditions, on public roads, where they cause the most harm to ambient air quality. By spotting them in situ, authorities can intervene early (repair, retire, re-test) rather than waiting for blanket testing. This is both efficient and fair, focusing effort where it yields biggest returns.
This insight has influenced inspection and maintenance strategies in many regions, where authorities learned that implementing vehicle emissions remote sensing for high-emitter identification was an effective and fair policy.
Single Measurements and Fleet-Level Evidence
A single remote sensing measurement is a snapshot of one vehicle under one real-world operating condition. When a single emissions measurement is extremely high, that alone can be used to identify a vehicle as a high-emitter. Apart from that application, another extraordinary value of remote sensing appears when many measurements are aggregated. Large datasets allow authorities and researchers to analyze vehicle emissions by vehicle categories, Euro standards, fuels, manufacturers, models, locations and driving conditions. This is why remote sensing is especially powerful when combining fleet characterization, high-emitter screening, policy evaluation and long-term monitoring.
With sufficiently large datasets, authorities can evaluate whether emission standards are working in practice, identify vehicle groups with abnormal emissions, detect deterioration with age, assess the effectiveness of low-emission zones and design fairer inspection and enforcement strategies.
A structural deployment of remote sensing can become a central layer in modern emissions inspection programs, connecting real-world roadside data with PTI/I&M stations, enforcement operations and policy evaluation
In summary
Real-world emissions data is valuable because it transforms vehicle emissions control from a purely laboratory-based system into an evidence-based monitoring system. With sufficiently large datasets, authorities can evaluate whether emission standards are working in practice, identify vehicle groups with abnormal emissions, detect deterioration with age, assess the effectiveness of low-emission zones, and design fairer inspection and enforcement strategies. A structural deployment of remote sensing can be the central part of emissions inspection program, connecting the road to the periodical technical centers and police enforcement operations.
3. Basic Physics and Chemistry
Measuring Gases with Light
At the heart of vehicle emissions remote sensing is a simple scientific principle:
Gases interact with light in predictable ways
Each gas molecule absorbs specific wavelengths of electromagnetic radiation depending on its molecular structure. Because every pollutant has its own characteristic absorption pattern, gases can be identified and quantified optically.
When a beam of light passes through a vehicle’s exhaust plume, part of that light is absorbed by the gases present in the plume. By analyzing which wavelengths are absorbed — and by how much — remote sensing instruments can determine the relative concentrations of different pollutants in the exhaust.
This principle forms the basis of optical absorption spectroscopy and underpins many atmospheric and laboratory measurement techniques.
The relationship between light absorption and gas concentration is commonly described by the Beer–Lambert law.
Vehicle emissions remote sensing applies this principle under unusually dynamic conditions. Unlike laboratory instruments, roadside systems must perform measurements in milliseconds while exhaust plumes are moving, dispersing and mixing with ambient air in an uncontrolled outdoor environment.
Infrared and Ultraviolet Spectroscopy
Most vehicle pollutants absorb radiation in the infrared (IR) region of the spectrum. Infrared remote sensing systems therefore use broadband IR light sources together with optical filters and detectors tuned to specific absorption bands associated with pollutants such as carbon monoxide (CO), hydrocarbons (HC), carbon dioxide (CO₂) and ammonia (NH₃).
Other pollutants, particularly nitric oxide (NO) and nitrogen dioxide (NO₂), absorb more strongly in the ultraviolet (UV) region. These species are especially important because of their role in urban air pollution, ozone formation and secondary particulate matter.
Ultraviolet wavelengths are also more sensitive to smoke and particulate-related optical effects. For this reason, UV measurements can additionally be used to estimate particulate emissions proxies and plume opacity.
Modern remote sensing systems therefore combine infrared and ultraviolet spectroscopy so they can simultaneously measure multiple pollutant classes from a single passing vehicle.
Particulate matter (PM) is more difficult to measure remotely than gaseous pollutants because particles interact with light differently from gases. Instead of directly measuring particle mass concentration or counting particles, most remote sensing systems estimate particulate emissions using optical opacity-related methods. UV wavelengths, particularly around 230 nm, are sensitive to smoke and particulate-related absorption and scattering effects within the exhaust plume. From these measurements, the RSD derives a Smoke Factor (SF), which represents plume opacity normalized by fuel consumption and is typically reported as grams of particulate matter per kilogram of fuel burned.
This value should be interpreted as a fuel-specific optical smoke or particulate indicator rather than a direct gravimetric PM mass measurement equivalent to laboratory certification procedures.
Which Pollutants are Measured?
Modern remote sensing systems can measure several important pollutants:
- carbon monoxide (CO),
- hydrocarbons (HC),
- nitric oxide (NO),
- nitrogen dioxide (NO₂),
- ammonia (NH₃),
- carbon dioxide (CO₂),
- and indicators related to particulate emissions (typically, PM).
Different systems may use different optical configurations and wavelength ranges depending on their intended applications.
The fundamental metric: Pollutant Emission Ratios
One of the key scientific principles behind remote sensing is that pollutants are measured relative to carbon dioxide (CO₂) rather than as absolute concentrations. This approach is essential because the exhaust plume from a moving vehicle is continuously diluted by ambient air. The effective plume path length and the amount of plume intercepted by the light beam depend on many external factors, including turbulence, wind speed, atmospheric mixing, vehicle speed and plume geometry. As a result, absolute pollutant concentrations in the open plume can fluctuate significantly even when the vehicle emissions themselves remain unchanged.
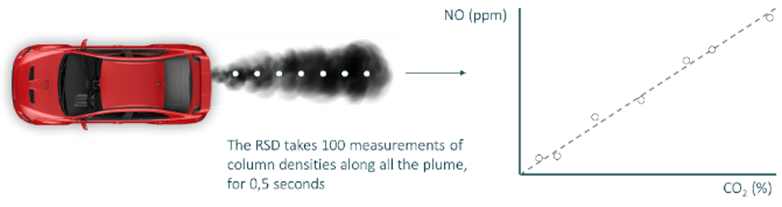
However, pollutant gases and CO₂ dilute together in approximately the same proportion. Because of that, the basic principle of vehicle emissions remote sensing is calculating the pollutant-to-CO₂ ratios from each passing vehicle, which is a metric that largely removes other factors and is the reason remote sensing can produce meaningful measurements from extremely short “snapshot” observations. The system analyzes the vehicle plume at a rate of 200Hz. Specifically, the system takes 100 samples in 0.5 seconds, to give unique pollutant ratios to CO2 per vehicle analyzed.
Instead of attempting to measure the total exhaust flow, the system determines the chemical composition of the exhaust relative to the amount of fuel being burned. The measured ratios can then be converted into fuel-specific or distance-specific emissions factors using combustion relationships and vehicle activity data.
The strength of this metric is that it largely removes the effect of plume dilution, allowing meaningful measurements from short, dynamic roadside observations. However, the vehicle’s operating condition still matters. Speed, acceleration, engine load, VSP, aftertreatment temperature and fuel type influence emissions and must be considered when interpreting the data.
The strength of this metric is that it allows us to analyze a vehicle’s pollution levels almost independently of driving style, external conditions, or dynamic conditions at the time of measurement. Since the system normalizes the concentration of each pollutant relative to the CO2 concentration, this ratio is not affected by whether the exhaust plume is larger or smaller at the time of measurement, or whether the driver is pressing the accelerator more or less. If the vehicle is clean, this ratio will tend toward zero, but if the vehicle is highly polluting, the ratio of pollutants to CO2 will be very high.
Background Correction and Signal Processing
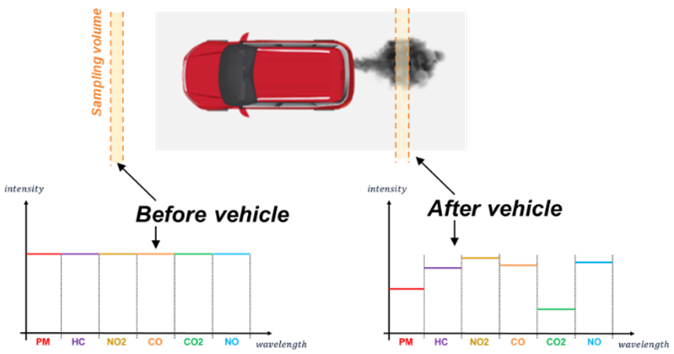
The gases measured by a remote sensing system are not present only in vehicle exhaust. Many species also exist naturally in ambient urban air. To isolate the contribution from the passing vehicle, the system continuously measures background atmospheric concentrations immediately before the vehicle enters the sensing beam. These background levels are then subtracted from the concentrations measured while the exhaust plume is crossing the optical path.
The remaining signal is attributed to the emissions from the vehicle being measured.
The resulting data provides tailpipe-equivalent pollutant concentrations and emissions ratios for each passing vehicle’s exhaust plume alone, subtracting any concentrations of pollutants present in the ambient air.
Scientific Principles
The scientific principles behind vehicle emissions remote sensing have been studied and validated extensively for more than three decades through laboratory experiments, field campaigns and comparisons with other emissions measurement methods. Foundational publications include:
- Bishop, G. A., Starkey, J. R., Ihlenfeldt, A., Williams, W. J., and Stedman, D. H., IR Long-Path Photometry: A Remote Sensing Tool for Automobile Emissions, Analytical Chemistry, 1989.
- Burgard, D. A., Bishop, G. A., Stadtmuller, R. S., Dalton, T. R., and Stedman, D. H., Spectroscopy Applied to On-Road Mobile Source Emissions, Applied Spectroscopy, 2006.
- SF is a calculated opacity per unit of fuel consumed reported as grams PM / kilogram fuel burned. The scientific principle and calculations are described in a Technical Bulletin (Remote Sensing Smoke vs Hartridge Smoke Units).
The methodology has since been validated through millions of roadside measurements worldwide and is now widely recognized as one of the most powerful tools available for studying real-world vehicle emissions.
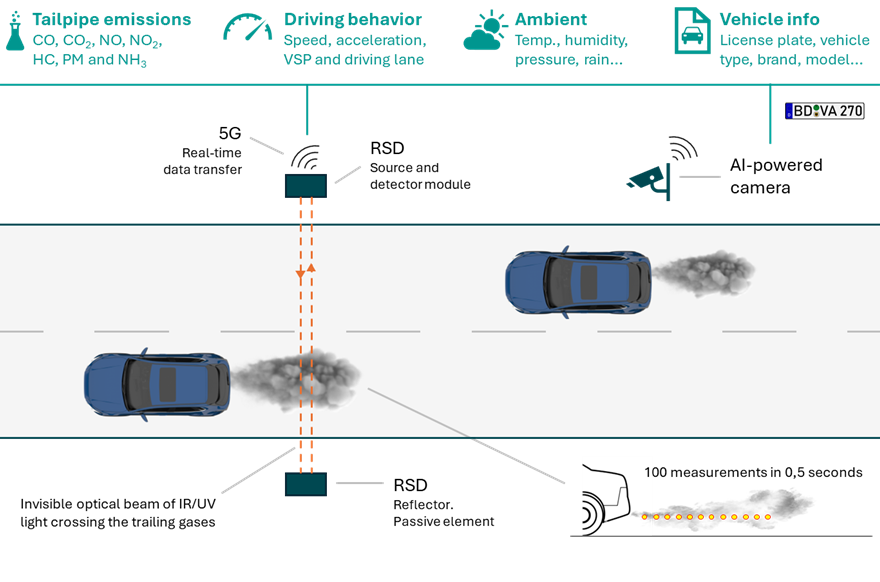
A Remote Sensing Device (RSD) is designed to remotely measure tailpipe emissions from vehicles under real-world driving conditions. Positioned at the sides of the road, it emits an invisible beam of ultraviolet (UV) and infrared (IR) light that crosses the roadway and returns to a detector, calculating the concentrations of pollutants in the exhaust plume of each vehicle that passes by. Simultaneously, a camera captures a digital image of the vehicle’s license plate and measures the vehicle’s speed and acceleration. Ambient parameters are also recorded during each measurement. The emissions data, kinetic conditions, weather information, license plate image, and other parameters are merged in less than a second.
1. System Architecture
An RSD is based on at least three modules. Together they form the basic architecture of a vehicle emissions remote sensing device:
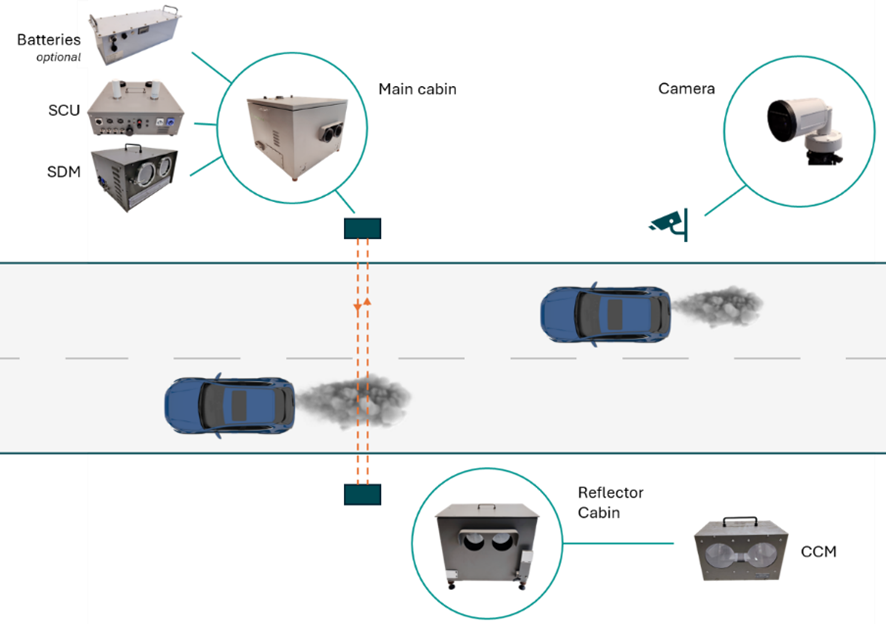
The RSD can include additional sensors or peripherals, such as:
- Acoustic camera, to measure each vehicle’s individual noise emissions (dBA).
- Meteorological station, to record ambient temperature, ambient relative humidity and ambient pressure, to include those readings in the data.
- Particle number counting, to record roadside PN concentrations or even estimate PN-to-CO2 ratios, integrated with the RSD.
- Air quality sensors, to record ambient air pollution concentrations at the site.
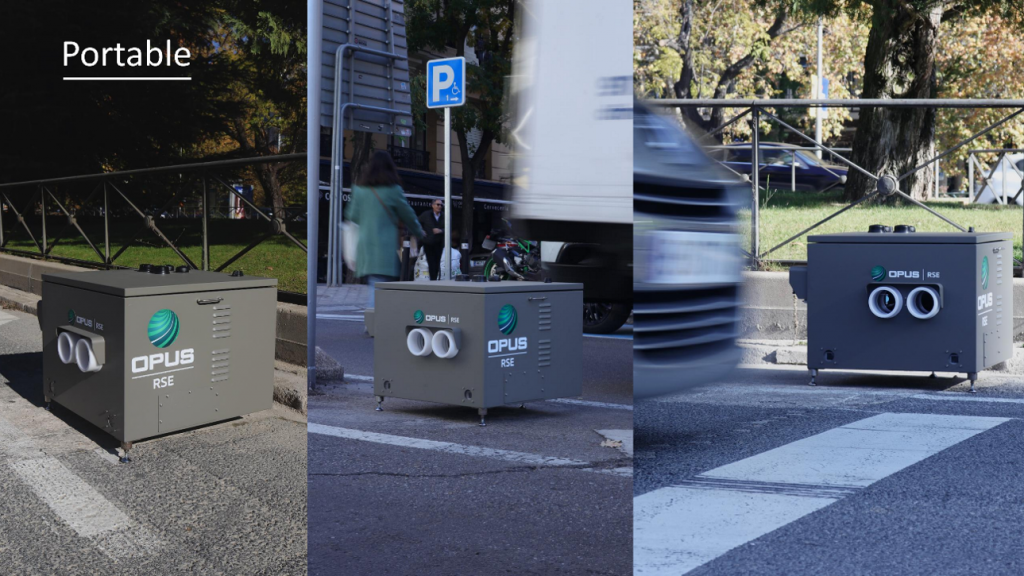
These components are assembled, protected and deployed in different ways. As the above picture shows, the modules are typically packed inside protective cabins, which can be of different types and can be portable or fixed to the roadside. These variants are shown in PART III.
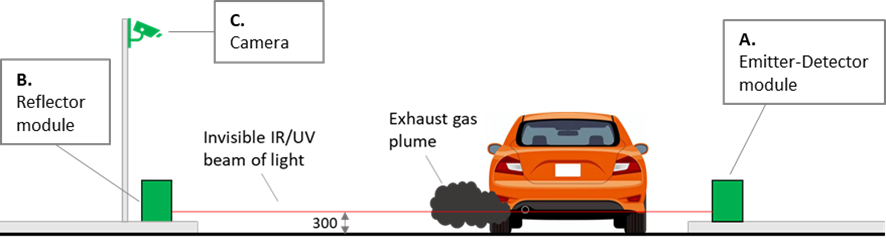
2. The Measurement Process
In a typical roadside installation, infrared and ultraviolet light beams are projected horizontally across the road at approximately tailpipe height, from the Main Module. The Reflector is positioned on the opposite side of the road, to return the light beam back to the Main Module. The distance between the Main Module and the Reflector can cover from 3 to 14 meters. One single RSD can be used to measure vehicles driving in 1-lane or 2-lane roads.
Both the Main Module and the Reflector can be placed far from the road edges, but on a solid surface. Depending on the type of system, they can be simply placed on the roadside, or fixed to the ground by different means.
The Camera can be deployed in different configurations, depending on the type of system used. For portable operations, the camera can be placed on the roadside using a portable tripod or disguised inside a traffic barrel. For fixed or semi-fixed deployments, the camera is attached to a 3-meters height pole or fixed to a nearby infrastructure (e.g. a traffic light).
A typical measurement process includes the following steps.
Step 1 — Vehicle detection: The camera identifies a vehicle approaching or crossing the sensing area. It records the vehicle image and collects visual information. The system may read the license plate, identify the lane, estimate the vehicle type and calculate speed and acceleration.
Step 2 — Exhaust plume detection: The optical system identifies an increase in CO₂ above background levels as the vehicle’s exhaust plume crosses the beam. The CO₂ peak helps the system identify the vehicle plume and trigger the emissions calculation. The peak of CO2 is typically found after the vehicle body (as the exhaust pipe is at the end of the body), but in some cases, like in trucks, the exhaust pipe is located under the chassis, so the peak of CO2 is detected between the wheels.
Step 3 — Optical sampling: The system collects a series of high-frequency samples from the exhaust plume as it passes through the optical beam. 100 samples of the exhaust plume in 0.5 seconds are taken. These samples are used to calculate pollutant-to-CO₂ ratios and validate plume behavior.
Step 4 — Background correction: The system continuously measures the background concentrations before the vehicle enters the sensing zone. Background concentrations are subtracted from the plume measurement so that the remaining signal is attributed to the passing vehicle.
Step 5 — Data validation: The system applies quality filters to determine whether the measurement is valid. A valid measurement requires a sufficiently strong plume, stable background conditions, correct vehicle attribution and suitable operating conditions. Measurements can be marked as valid or invalid for each pollutant independently.
Step 6 — Data integration: The emissions record is combined with vehicle speed, acceleration, ambient conditions, vehicle image, license plate data and available vehicle registry information. This creates a single vehicle measurement record that can be used for analysis, reporting, enforcement support or fleet monitoring.
3. Data Quality and Instrument Calibration
The accuracy and precision of each unit deployed on the road must be ensured through a comprehensive set of protocols and methods:
All this quality assurance is a fundamental requirement for these measurement instruments. The standard that clarifies all these specifications is UNE 82509:2026.
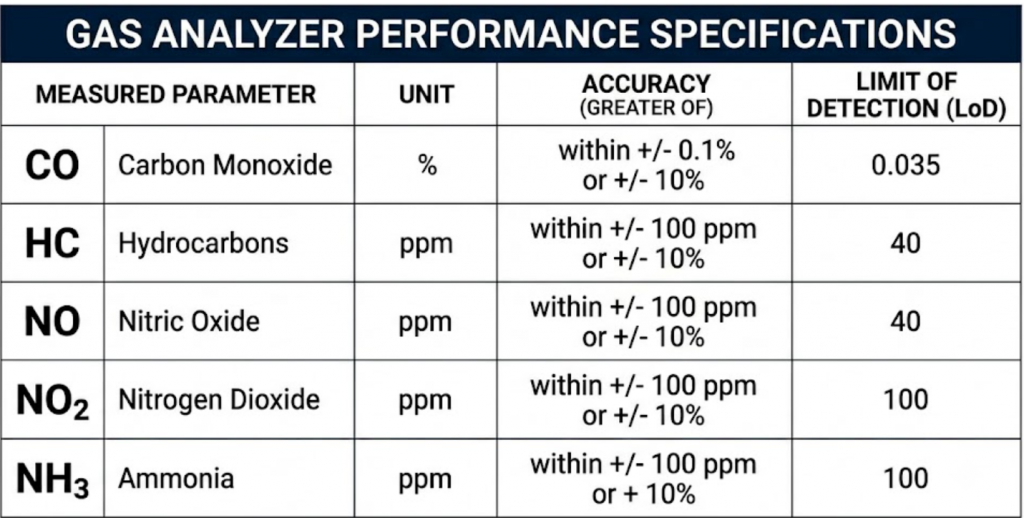
4. Accuracy and Validation
The RSD is internationally tested, certified and validated. It is the most cost-effective vehicle emissions inspection method in the world, as it allows thousands of vehicles to be analyzed remotely, non-intrusively, and automatically every day.
The accuracy specifications are shown below.
There is a long history of scientific and regulatory validations on this technology.
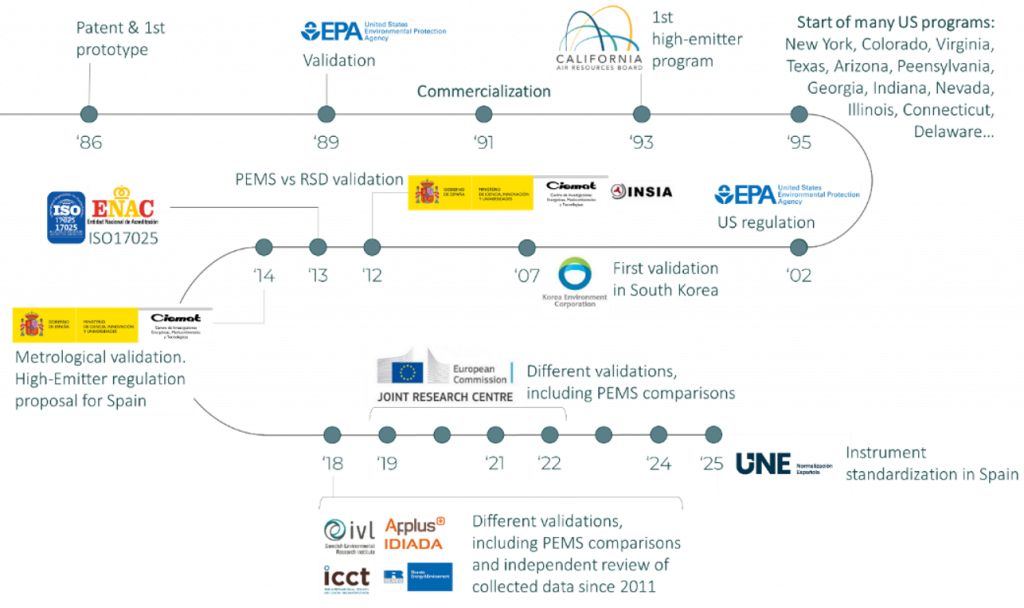
Not only has the technology been validated for a long time, but it also has specific accreditations. OPUS RSE is the world’s only ISO-17025 accredited company for the remote measurement of real-driving vehicle emissions. This accreditation is granted by the Spanish Accreditation Agency (ENAC), through the Spanish Ministry of Industry, giving the entity the ability to report emissions from remotely measured vehicles with demonstrable uncertainties and accuracies.
Other organizations independently and uniformly evaluate each RSD deployed on the street. Some of these entities are the State of Colorado in the US, the South Korean Environmental Control Agency, and the Taiwan Environmental Control Agency. These entities test each instrument, issuing a certificate that enables its use for actual high-emitter detection programs or other operational purposes
The most important reference for accuracy and validation of these instruments is standard UNE 82509:2026. This standard defines metrology, requirements and tests of these instruments and includes conformity assessment and verification. In short, this standard covers:
- Technical requirements
- Metrological requirements
- Testing methods
- Verification procedures
Some results about accuracy and general performance of RSDs are shown below.
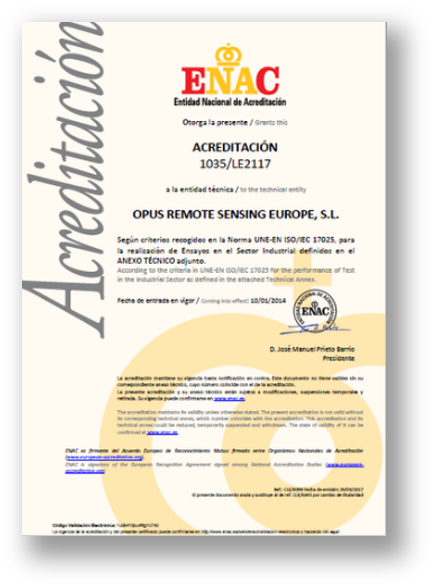
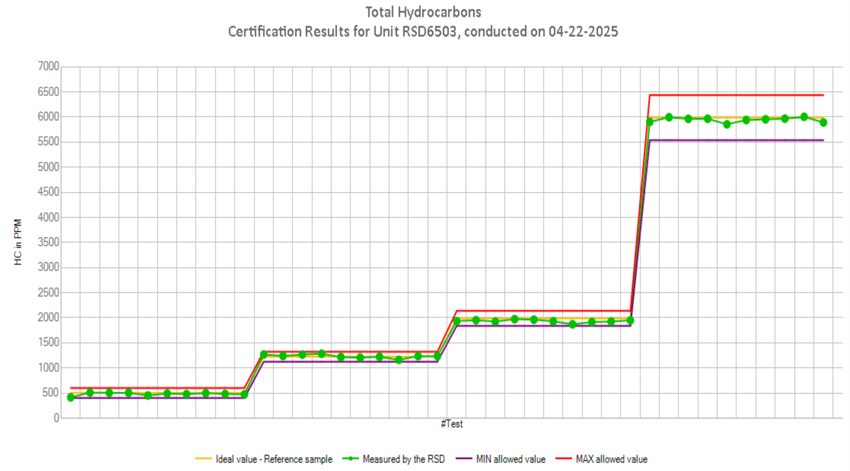
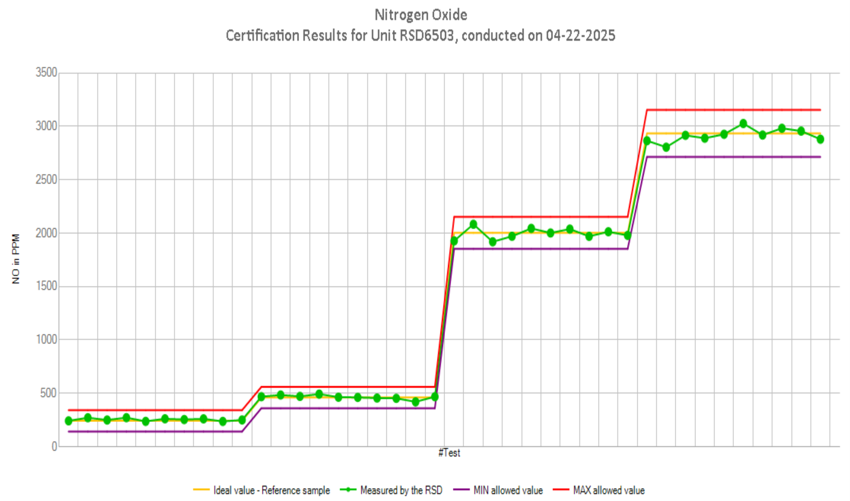
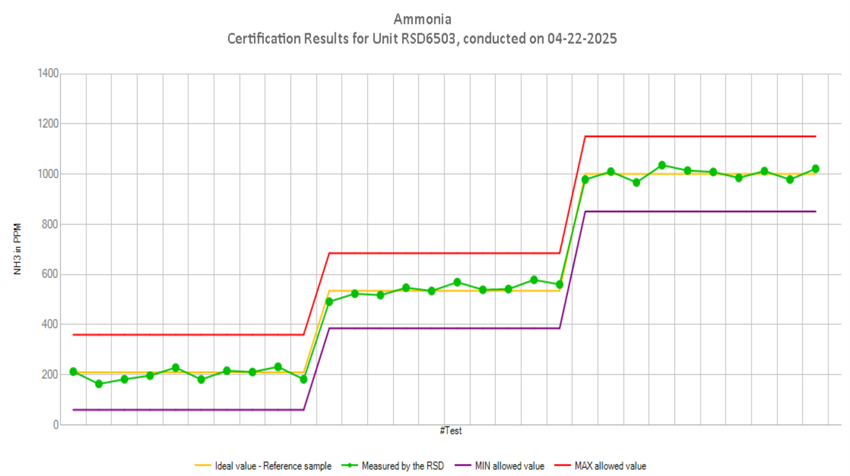
Standardized test results:
The accuracy and repeatability of the RSD are verified by introducing gas plumes of known gases into the RSD’s optical path and comparing the concentrations measured by the instrument with the known concentrations generated from gas mixture cylinders certified by laboratories. Several cylinders containing multiple gas mixtures with widely varying concentrations are used.
This method is the industry standard, as defined in the UNE 82509:2026 standard, but it is also used in other regulations and procedures, such as U.S. EPA regulations, the Colorado COVER standard, acceptance procedures of agencies in South Korea and Taiwan, and the OPUS RSE technical procedure under ISO 17025.
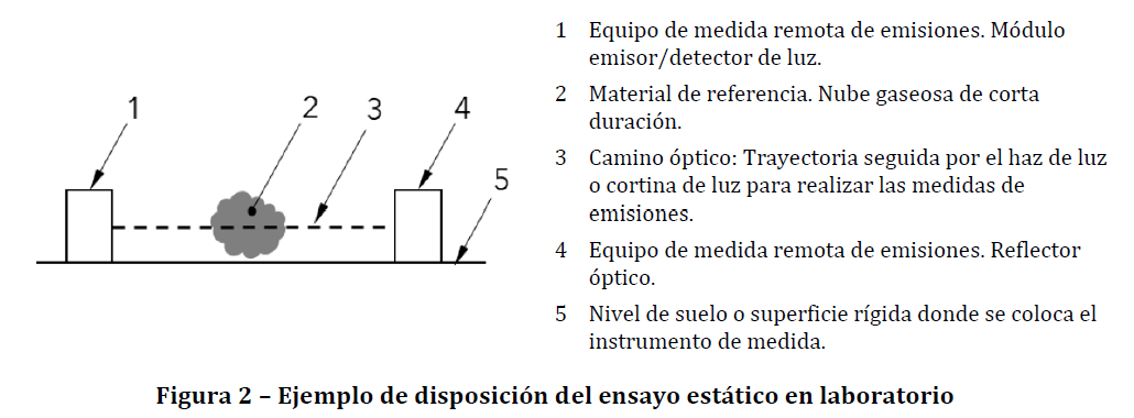
Some results are shown below:
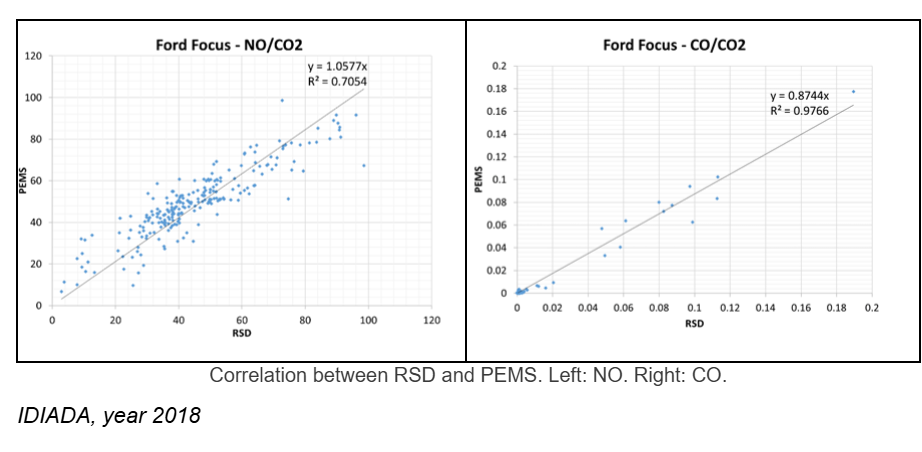
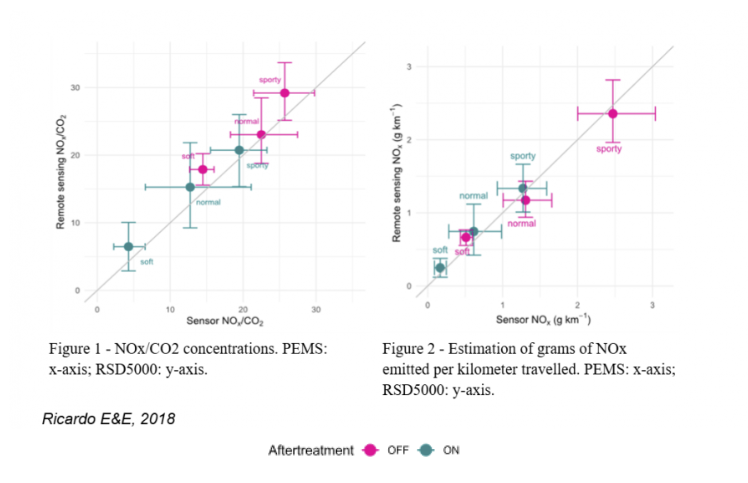
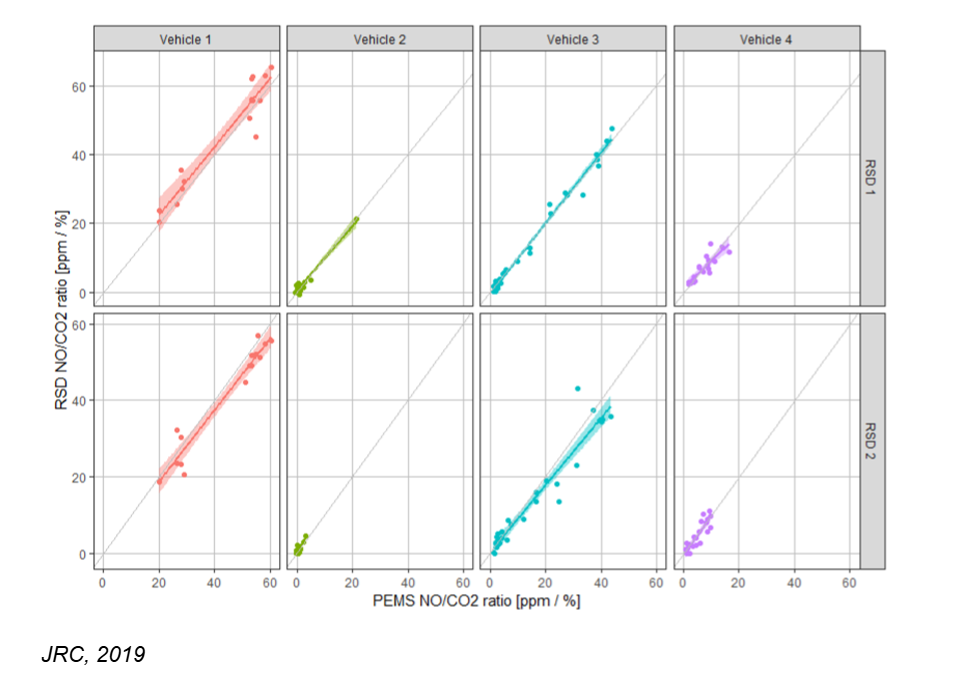
Other tests include the comparison of the RSD measurement to PEMS measurements. Although
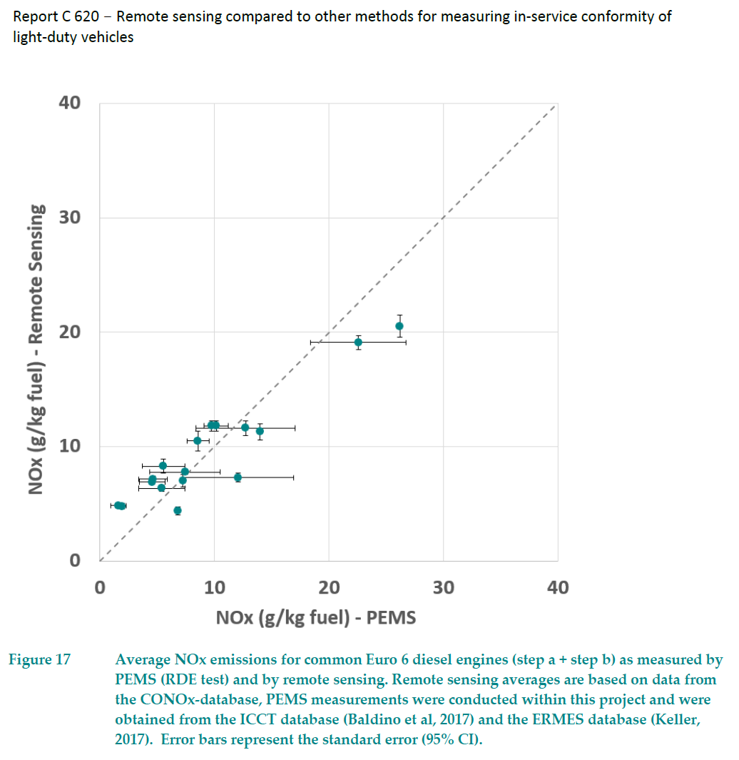
https://www.ivl.se/english/ivl/publications/publications/contribution-of-vehicle-remote-sensing-to-in-service-real-driving-emissions-monitoring—conox-task-3-report.html
5. What Remote Sensing Cannot Do
Although the RSD is an incredible technology, extraordinarily versatile and with countless applications, it is not a magic bullet, and like any tool or technique, it must be designed and applied correctly.
The RSD has several fundamental applications, which can then be adapted into different variations: high-emitters identification, traffic emissions characterization, police enforcement, fleet evaluation and certification and advanced tolling and access control.
What RSD is not or cannot do is discussed below.
- The RSD is not an air quality sensor
There are air quality sensors or monitoring stations that measure the concentration of various pollutants in the environment. These systems monitor air quality by measuring the ambient concentration of pollutants. They therefore measure the final result of the mixture of pollutants from different emission sources.
RSDs, on the other hand, measure the concentrations of pollutants emitted by vehicles, not the final air quality. RSDs are therefore crucial for understanding the contribution of traffic to air quality, but they measure different things.
- The RSD is not an instrument for vehicle type-approval
When vehicles are type-approved, highly accurate laboratory systems are used, and controlled tests are conducted on the vehicles to measure their emissions according to pre-established protocols.
Although the RSD measures a vehicle’s specific emissions, it is not an instrument used for vehicle type-approval.
The RSD can indeed operate in accordance with ISO 17025 to issue laboratory reports, but these reports can only determine whether a vehicle is emitting at normal levels or is a high-emitter.
When the RSD compiles thousands of measurements from the real-world vehicle fleet, aggregating these enormous amounts of data does allow for evaluating averages and analyzing emission distributions to determine whether, for example, certain groups of vehicles or engine types emit levels in the real world that are expected or comparable to those in type approval.
- The RSD cannot measure vehicles if they are not in motion and burning fuel
Although this may seem obvious, it is one of the most common misconceptions. The RSD must measure vehicles while taking two factors into account:
- The vehicle must be in motion, as the measurement process is designed for dynamic measurement, detecting the vehicle’s passage, identifying a peak in emissions, and taking 100 measurements of the exhaust plume as it disperses into the atmosphere. Therefore, the RSD must be placed at locations where traffic flows smoothly, where vehicles do not stop, and where there are no traffic jams.
- The driver must be pressing the accelerator pedal to ensure a minimal amount of exhaust gases are being emitted from the tailpipe. If the driver is not pressing the pedal, no exhaust gases are being emitted, and while the RSD will detect the vehicle passing by the sensor, it will mark the exhaust gas measurement as invalid.
- The RSD cannot measure anywhere
This is primarily related to the previous point, and because the system consists of modules that must be positioned in a specific way, the RSD cannot or should not be placed just anywhere; rather, it is necessary to determine which specific locations are compatible with the deployment and where it makes sense—or does not make sense—to take measurements.
- The RSD cannot measure under all environmental conditions
The RSD is a very robust system. Its protective enclosures allow it to operate in almost any environmental condition while meeting its specifications:
- Ambient temperatures operating range: -5°C to +50°C.
- Altitude operating range: -500 m to 4,000 m.
- Ambient humidity operating range: 0 to 95% (non-condensing)
However, it has some limitations, as any other measurement instrument.
There is no possibility to correctly measure with an optical remote sensing technique the exhaust emissions from vehicles during rain. The rain droplets mix with pollutant molecules in the air, and they even encapsulate the particulate matter. The RSD can measure exhaust emissions during rain, but the measurements are marked as invalid, as it is a mix of water and pollution that cannot be separated for analysis. Fixed and Semi-fixed systems include a rain sensor, so when the system detects rain, it pauses the data collection and resumes the data collection when rain stops. Cross-road remote sensing equipment does not include any element on the roadway, so there is no need to dry or clean the system until it starts to measure correctly again.
Similarly, below -5ºC degrees the fuel combustion is abnormal, and water vapor also crystalizes very fast. Although the RSD can measure exhaust emissions below this temperature, it is recommended to mark these measurements as invalid as the vehicle is not emitting in a normal condition.
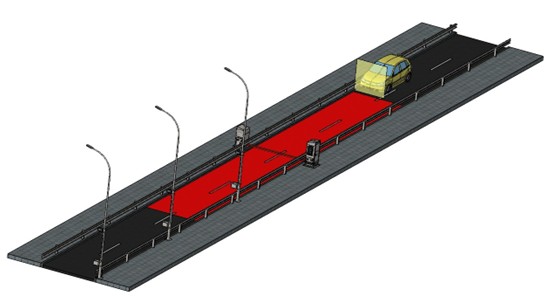
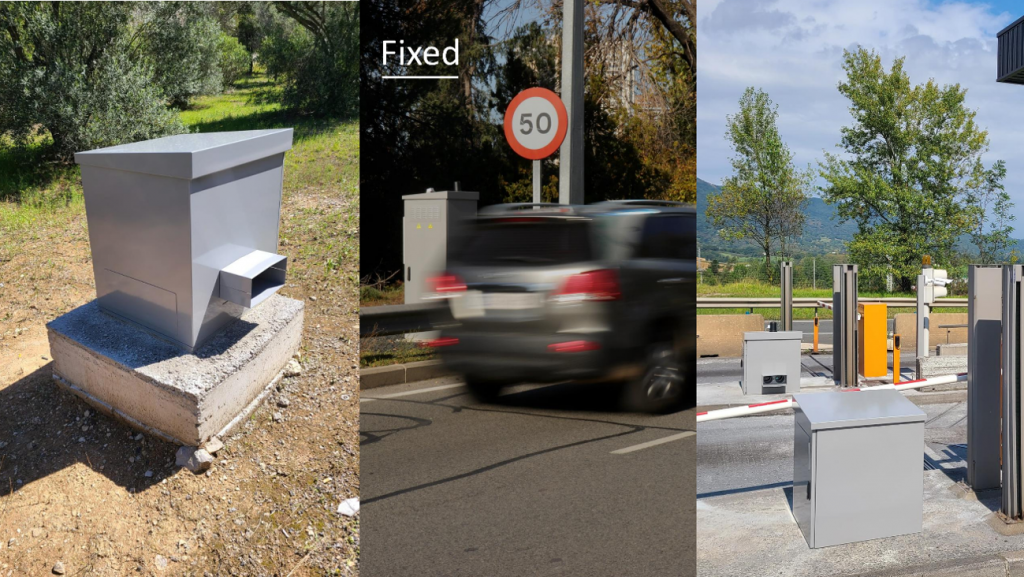
1. Types of Deployment
The same System Architecture (SDM, SCU, CCM and Camera) can be deployed in different ways:
- Portable, unprotected: the components of the RSD can be simply placed on the roadside on 3-leg stands. This deployment is extremely fast (5 minutes), allowing immediate deployment with the smallest footprint possible, but the modules are unprotected. This is typically used for testing, validation or short-time measurements.
- Portable, protected and with integrated batteries: the components of the RSD are packed in IP65 protective boxes, for quick and easy deployment, but including a good protection. The deployment is also very fast (10 minutes). This configuration allows the RSD to be easily transported and placed at a specific site without any prior preparation. The system is set up in a few minutes and starts measuring autonomously. The portable cabin includes internal batteries with 24 hours of autonomy. It can be picked up at the end of the day and placed at the same or another site, whenever desired.
- Fixed installation: the components of the RSD are housed inside robust traffic cabins, which are anchored to the sides of the road. This configuration requires a pre-installation of the cabins and external power supply, but allows the RSD to measure uninterruptedly, 24/7, at a specific site. Once installed, the system does not require any attention or maintenance for months.
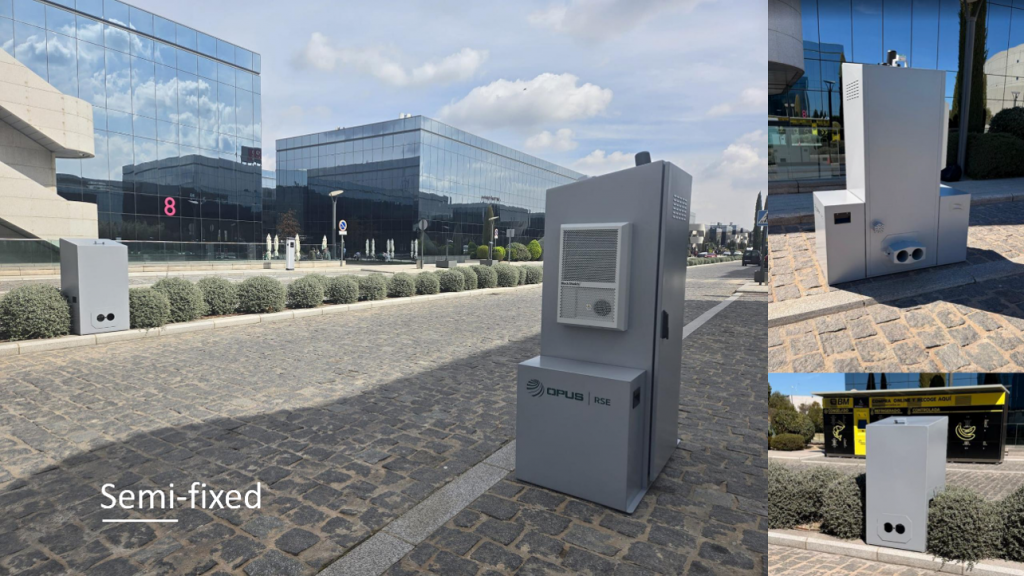
- Semi-fixed deployments: similar as the fixed deployment, but the cabins include an extra module for batteries. The cabins are not permanently fixed and there is no power supply, but the RSD can operate uninterruptedly, 24/7, at a specific site, with a human battery swap every 48 hours.
It must be remarked that the same instrument can be used in all the four different deployment variants, as the only difference is the protective cabins and small ancillary equipment.
In short:
Portable deployment is especially useful for:
- short-term measurement campaigns,
- exploratory studies,
- site evaluation,
- targeted enforcement support,
- temporary projects,
- and rapid-response operations.
Portable systems allow operators to collect data from many sites over a short period, and they are ideal when geographical coverage and flexibility are more important than permanent infrastructure. The main limitation is that portable deployments typically require more field logistics and supervision than fixed stations.
Semi-fixed deployment is especially useful for:
- medium-term campaigns,
- regional fleet coverage,
- rotating enforcement support,
- projects requiring 24/7 monitoring without permanent infrastructure,
- and programs that need both autonomy and flexibility.
Semi-fixed systems can remain deployed at a location for days, weeks or months and then be relocated efficiently to a new site. This makes them one of the most versatile deployment models for modern remote sensing programs, but have more limitations on site selection than portable setups.
Fixed deployment is especially useful for:
- permanent monitoring programs,
- continuous traffic emissions surveillance,
- structural inspection programs,
- continuous enforcement support,
- tolling or access-control integration,
- and long-term policy evaluation.
Fixed deployments require more preparation, permitting and infrastructure than portable or semi-fixed systems, but once installed, they provide the lowest operational cost per valid measurement over long periods. They also enable continuous data collection, long-term trends and integration with digital traffic infrastructure.
Camera deployment:
Remote measurement of vehicle emissions requires not only the measurement of exhaust gases but also visual identification of the vehicle. Typically, this identification involves reading the vehicle’s license plate, as it serves as the vehicle’s unique identifier; however, in certain applications, it may require identifying other visual characteristics of the vehicle. In any case, this means that camera placement is a critical component of the proper operation of this type of technology.
Depending on the application of the technology, the type of technology deployed, and the measurement location, the camera(s) associated with the RSD can be deployed in different ways. There are primarily two variants:
- Camera placed at roadside level, on a tripod, or inside a traffic barrel.
- Camera installed at a height (e.g., 3 meters high), on a streetlight, an existing or new traffic pole, etc.
If the RSD is portable, the camera is typically mounted on a tripod or similar device, connected by cable to the RSD. If the RSD is fixed or semi-fixed, the camera is mounted at a height. In the case of a fixed setup, connectivity and power are provided via cable, directly connected to the RSD. In the case of a semi-fixed setup, the camera can be battery-powered and connect to the RSD via Wi-Fi.
It is recommended that the camera be positioned about 10 meters away from the RSD, either in front of or behind it. Depending on the location and requirements, this means it will capture the front or rear of vehicles. It is also recommended that the camera be as close to the edge of the road as possible to ensure an optimal visual angle.
2. Operational Strategy
The operational strategy for a vehicle emissions remote sensing program is fundamentally based on maximizing the representativeness and statistical value of the collected data while ensuring safe and efficient operation of the Remote Sensing Devices (RSDs). The deployment strategy must therefore balance technical constraints, traffic dynamics, fleet diversity, operational logistics, environmental conditions and the final objectives of the campaign.
The operational model for a vehicle emissions remote sensing program may be based on a flexible combination of portable, semi-fixed and fixed RSD deployments, depending on the operational or regulatory objectives of the program, the available infrastructure, the required geographical coverage and the desired balance between deployment flexibility and autonomous long-term monitoring.
Portable deployments provide the highest operational flexibility and are particularly useful for targeted operations, exploratory studies, temporary campaigns and rapid deployment scenarios. Portable systems can be rapidly deployed at almost any compatible roadside location without prior preparation, civil works or external infrastructure. Deployment times are only a few minutes, allowing targeted short-term operations, exploratory campaigns, rapid-response studies, enforcement support, validation activities or measurements at highly specific locations. Portable systems are especially valuable when evaluating many candidate sites, when conducting temporary studies or when maximizing geographical coverage over short periods. Their main limitation is that, although the systems work autonomously, they typically require some presence of an operator or field technician for supervision. The system is typically deployed in the morning and can be removed at the end of the day, charging the batteries overnight.
Fixed deployments provide the highest level of operational autonomy and long-term productivity. In this configuration, the RSD components are permanently housed inside robust roadside cabinets anchored to the ground and connected to continuous external power supply. These systems can operate fully autonomously 24 hours per day and 7 days per week for months with minimal or zero human intervention. Fixed stations are ideal for strategic long-term monitoring locations, continuous emissions surveillance and real enforcement programs. Although fixed deployments require civil work and external power infrastructure, they provide the lowest operational cost per valid measurement over long periods due to their fully unattended operation.
Semi-fixed deployments represent an intermediate and highly versatile solution between portable and fully fixed systems and are often considered one of the most powerful operational approaches for medium- and long-duration campaigns and wide geographical coverage. In this configuration, the RSD is installed inside the same protective roadside cabinets as the fixed stations, but without requiring permanent anchoring or concrete foundations. The stations are powered by integrated battery systems (unless temporary power supply is available) capable of supporting autonomous operation for approximately 48 hours before battery replacement is required. Semi-fixed systems therefore combine many of the operational advantages of fixed stations — including 24/7 autonomous monitoring, robust weather protection, remote communications, and continuous operation — while preserving high deployment flexibility and minimizing permitting and infrastructure requirements.
This intermediate approach is particularly powerful for medium-term campaigns, temporary studies, regional fleet characterization programs and projects requiring rotation between multiple sites. Semi-fixed stations can remain deployed at a location for several weeks and later be relocated efficiently to a new site. Battery replacement operations are simple and do not require stopping the measurements.
The combination of portable, semi-fixed, and fixed deployments creates a highly powerful operational ecosystem because it allows the monitoring strategy to be adapted dynamically to different program objectives, operational constraints and policy needs. Portable systems maximize flexibility and geographical reach. Fixed stations maximize long-term autonomous productivity and minimize maintenance costs. Semi-fixed systems provide an optimal balance between operational autonomy and deployment flexibility.
In practice, implementing a remote sensing program often requires balancing several factors, including operational cost, required geographical coverage, number of measurement sites, fleet representativeness, availability of roadside infrastructure, duration of the campaign, program objectives and long-term versus short-term monitoring needs.
Depending on these factors, a remote sensing program may combine all three deployment methodologies simultaneously. For example, a program may use fixed stations at strategic long-term urban locations, semi-fixed stations rotating between regional corridors and portable systems for very targeted enforcement support or exploratory measurements.
All deployment variants share the same fundamental RSD measurement technology, data processing architecture, calibration methodology and analytical capabilities. The differences lie primarily in the protective infrastructure, power supply strategy, operational autonomy, and logistical flexibility of deployment.
SITE SELECTION
Site selection is one of the most critical elements of any remote sensing project. The quality, representativeness and usefulness of the collected emissions data depend heavily on selecting locations that simultaneously satisfy deployment constraints, valid driving behavior and representative fleet composition.
Remote sensing systems require vehicles to circulate under loaded driving conditions while maintaining smooth and uninterrupted traffic flow. Therefore, ideal sites are locations where drivers apply moderate acceleration or engine load while maintaining stable vehicle trajectories.
Typical best sites include:
- acceleration ramps,
- access roads to urban areas,
- exits from roundabouts,
- highway access lanes,
- toll plazas,
- arterial roads with moderate acceleration,
- roads with positive gradient,
- urban corridors with stable traffic flow,
- logistics corridors,
- entries to ports, depots or industrial areas,
- and roads with high heavy-duty vehicle traffic when that category is relevant.
Conversely, sites with traffic congestion, stop-and-go traffic, frequent braking, flat roads or stationary queues are generally unsuitable because they reduce the probability of obtaining valid exhaust plume measurements. Vehicles need to be in motion and drivers are smoothly accelerating when passing by the RSD.
The primary technical criteria for selecting remote sensing locations include:
Essential Requirements
- Sufficient physical space on both sides of the road for deployment of the Main Module and Reflector Module.
- Safe separation between equipment and circulating traffic.
- Stable roadside surfaces suitable for cabinet placement.
- Adequate positioning for the camera system.
- One or Two-lanes roads.
- Moderate and continuous traffic intensity.
- Locations where vehicles naturally operate under moderate engine load.
Preferred Operational Conditions
- Vehicle Specific Power (VSP) conditions representative of real-world operation.
- Diversity of vehicle categories.
- Availability of nearby power supply when possible.
- Availability of maintenance access or nearby parking.
- Locations allowing secure deployment without lane closures.
The use of multiple sites is particularly important in fleet characterization projects because vehicle composition varies significantly across urban centers, industrial zones, highways, residential areas and logistics corridors. A multi-site deployment strategy reduces sampling bias and improves the representativeness of the dataset. Operational experience worldwide demonstrates that the highest productivity sites are usually access corridors to metropolitan areas, urban ring roads, highway ramps and moderately loaded arterial roads. Additionally, long-term or semi-permanent monitoring locations can be selected to study the evolution of fleet emissions over time, evaluate the effectiveness of air quality protection measures, assess policy impacts or support continuous enforcement strategies.
FLEET AND GEOGRAPHICAL COVERAGE
A robust operational strategy must ensure that the collected measurements provide statistically representative coverage of both the geographical area of interest and the circulating vehicle fleet. Vehicle fleets are highly heterogeneous and emissions behavior varies depending on vehicle category specifications.
Consequently, measurements should be distributed across different geographical areas and traffic environments to avoid overrepresentation of specific vehicle groups. To maximize fleet diversity and minimize repeated measurements of the same vehicles, RSD stations may rotate between sites during the campaign.
Real-time dashboards allow project managers to evaluate:
- Number of valid measurements.
- Vehicle category distribution.
- Geographical coverage.
- High-emitter prevalence.
- Capture rates.
- Instrument status.
- Weather interruptions.
- Operational efficiency.
This continuous supervision enables rapid adaptation of the campaign if any fleet subgroup becomes underrepresented.
The operational strategy is therefore not only a deployment methodology, but also a scientific sampling framework designed to maximize the technical, statistical and regulatory value of the collected emissions data.
3. Data Processing and Data Analysis
Remote measurement of vehicle emissions is complex, as different systems and sensors must operate in a coordinated and perfectly synchronized manner. Various metrics and parameters must be processed in real time to monitor each vehicle automatically and non-intrusively. The RSD includes an advanced processing and communications module (SCU), which features a CPU, AI-GPU, 5G modem, and various state-of-the-art computing systems. In this way, the SCU itself integrates all the data from the different subsystems.
For every passing vehicle, all data: emissions, kinetics, vehicle info, ambient readings, photograph, etc. is aggregated into a single measurement record. All data is stored on the SCU’s computer and can also be monitored remotely by an operator stationed in a mobile unit parked safely along the roadside. Data is sent to a Server in real-time if the modem in the SCU is equipped with a SIM card.
The RSD provides real-time access. Every RSD data collection and status can be monitored online. Data can be integrated in traffic control centers or enforcement platforms.
Pollutant ratios alone are useful, but researchers and regulators often need emissions expressed in more practical units, such as grams per kilogram of fuel-burned or grams per kilometer-travelled. To achieve this, remote sensing systems combine pollutant ratios with combustion chemistry relationships, vehicle specs and vehicle activity data. By querying technical characteristics associated to each license plate (fuel type, propulsion type, vehicle call, brand, model, age…), the RSD can automatically process all the information to provide real-time advanced analytics.
The following list shows the main parameters captured or required for vehicle emissions remote sensing:
- site ID,
- site coordinates,
- road slope,
- instrument ID,
- instrument version,
- date and timestamp,
- unique measurement ID,
- vehicle speed,
- vehicle acceleration,
- vehicle specific power,
- vehicle lane,
- license plate image,
- license plate text,
- vehicle category,
- ambient temperature,
- ambient pressure,
- ambient relative humidity,
- CO/CO2
- HC/CO2
- NO/CO2
- NO2/CO2
- NH3/CO2
- smoke or particulate-related indicator,
- pollutant validity flags,
- plume quality indicators,
- and vehicle registry information where legally available.
Vehicle registry information may include:
- fuel type,
- propulsion type,
- Euro standard or emissions standard,
- brand,
- model,
- registration date,
- engine size,
- engine power,
- vehicle mass,
- vehicle category,
- and body class.
Pollutant ratios alone are useful, but researchers and regulators often need emissions expressed in practical units such as grams per kilogram of fuel or grams per kilometer.
To estimate these values, remote sensing systems combine pollutant ratios with combustion chemistry relationships, vehicle characteristics and vehicle activity data.
Advanced analytics can then identify patterns by fleet segment, technology, geography, policy area or individual vehicle behavior.
This is where remote sensing becomes more than roadside measurement.
It becomes a real-world emissions intelligence system.
4.Applications
Once you understand how the technology works, how it should be deployed, and what operational alternatives are available, it becomes easier to understand its applications.
- High-emitter detection
High-emitter detection is one of the most important applications of vehicle emissions remote sensing. Because emissions are often unevenly distributed across a fleet, identifying the highest-emitting vehicles can produce large environmental benefits.
Remote sensing can measure vehicles in normal traffic and detect those with abnormally high emissions compared with similar vehicles.
High emitters may be caused by many reasons, such as failed aftertreatment systems, catalyst malfunction, diesel particulate filter problems, SCR malfunction, ammonia slip, engine defects, poor maintenance, tampering, illegal modifications or abnormal operating behavior.
A high-emitter program can use remote sensing devices to select vehicles for additional inspection, repair requirements, enforcement action or targeted communication. This allows policies to focus resources on vehicles with the greatest impact on emissions.
- Clean screening
Clean screening is the use of remote sensing to identify vehicles with consistently low emissions. In some inspection programs, clean vehicles may be eligible for inspection exemptions, simplified procedures or reduced testing burden.
Clean screening can improve convenience for drivers while maintaining environmental integrity. The principle is simple. If a vehicle has been measured under valid conditions and shows very low emissions, it may not need to undergo the same inspection procedure as vehicles with unknown or suspicious emissions behavior.
Clean screening can help inspection programs become more efficient, more targeted and more data-driven.
- Traffic emissions characterization
Remote sensing can characterize emissions from the real circulating fleet. This is valuable for cities, researchers, governments and environmental agencies that need to understand how traffic emissions vary by vehicle type, technology, age, fuel and location.
Fleet characterization can answer questions such as:
- Which vehicle categories contribute most to urban transport emissions?
- How do diesel and gasoline vehicles compare in real-world conditions?
- Are newer Euro standards performing better on the road?
- Which vehicle ages show the strongest deterioration?
- How much do high emitters contribute to total fleet emissions?
- Are low-emission zones changing real-world fleet emissions?
- Are certain models or technologies showing abnormal emissions behavior?
This type of analysis is difficult to obtain from laboratory testing alone. Remote sensing provides the scale needed to observe fleet-level patterns directly.
- Enforcement support
Remote sensing can support enforcement by identifying vehicles that may require additional inspection or roadside control. It can help authorities prioritize enforcement resources and focus on vehicles with evidence of abnormal emissions behavior.
Remote sensing can be used to preselect vehicles for roadside inspection and provide evidence for follow-up procedures. When designed properly, it can make enforcement more efficient, evidence-based and fair.
- Fleet evaluation and certification
Fleet operators, public authorities and transport agencies increasingly need to understand the real-world emissions performance of their vehicles. Remote sensing can evaluate fleet emissions without removing vehicles from service or installing equipment on board.
This is useful for bus fleets, municipal fleets, logistics fleets, taxi and ride-hailing fleets, heavy-duty fleets, public procurement programs and environmental fleet certification schemes.
Remote sensing can help identify high-emitting vehicles within a fleet, verify improvements after repair, compare vehicle technologies, support sustainability reporting and ensure vehicle fleets are within acceptable emission levels.
- Market surveillance
Market surveillance is the monitoring of vehicles already in use to verify whether they perform as expected under real-world conditions.
Remote sensing can support market surveillance because it can collect large datasets across many vehicles, manufacturers, models and emissions standards. This can help regulators identify vehicle groups with abnormal real-world emissions behavior or support prioritization of further investigation with PEMS, laboratory testing or technical inspection.
Remote sensing does not replace detailed regulatory investigation, but it can help detect patterns that would otherwise remain hidden.
- Low-emission zones and other urban access schemes
Low-emission zones and urban access policies are designed to reduce pollution exposure and improve air quality by restricting the circulation of certain vehicles. However, their real impact depends on the vehicles that are restricted to circulate within and around the zone.
Remote sensing can help evaluate whether these policies are producing real-world emissions reductions or use the data to better plan these regulations. Remote sensing can measure fleet composition and emissions before and after policy implementation, it can compare options, vehicle categories and time periods. It can also detect whether high emitters continue to circulate in sensitive areas.
This gives cities a more objective and data-driven way to evaluate environmental mobility policies.
Remote sensing can also support future road pricing, tolling and access-control strategies based on real-world environmental performance.
Traditional access schemes often rely on vehicle category, age, fuel type or emissions standard. Remote sensing adds another layer: actual measured emissions. This makes it possible to design systems that are more closely aligned with real environmental impact.
Potential applications include:
- dynamic environmental tolling,
- high-emitter access restrictions,
- differentiated road pricing,
- clean vehicle incentives,
- and integration with intelligent transport systems.
These applications require careful legal, technical and data-governance frameworks, but they illustrate the long-term potential of remote sensing as part of smart mobility infrastructure.
- Long-term and total transport emissions monitoring
Remote sensing can be deployed as a long-term monitoring network, enhancing other policies and regulations.
Fixed and semi-fixed stations can collect continuous data over months or years. Portable systems provide flexibility and support monitoring and targeted actions.
This allows authorities to collect very large datasets and monitor a large share of the circulating fleet, observing trends in real-world emissions over time.
Long-term monitoring can help evaluate fleet renewal, boost inspection program effectiveness, monitor policy impacts and automatically enforce high-emitters.
In this role, remote sensing becomes part of the environmental nervous system of road transport. It connects vehicles, traffic, air quality, inspection policy and public health through real-world data.
Vehicle emissions remote sensing did not emerge overnight and it is not a prototype. Its development reflects four decades of scientific experimentation, regulatory pressure, technological innovation and growing concern over real-world vehicle pollution. From the first roadside optical systems in the 1980s to today’s AI-driven advanced roadside networks, remote sensing has evolved into one of the most important tools for understanding and controlling traffic emissions under actual driving conditions.
1. The Origins of Vehicle Emissions Remote Sensing
In the 1980s, many cities in the United States were still struggling with carbon monoxide and ozone pollution from road traffic. Inspection and maintenance programs existed, but they depended on periodic tests performed in garages or inspection stations. These tests were useful, but they had an obvious limitation: they did not necessarily show what vehicles were emitting in real traffic.
The breakthrough came at the University of Denver, where Donald Stedman and Gary Bishop pioneered the first open-path systems for measuring vehicle exhaust plumes from the roadside. The early work was funded first by the Colorado Office of Energy Conservation and later by the California Air Resources Board in the late 1980s. The original system became known as FEAT, the Fuel Efficiency Automobile Test, and was initially designed to identify gasoline vehicles with high carbon monoxide emissions. The idea was elegant: instead of stopping vehicles, place an infrared beam across the road, let vehicles drive through it normally, and read the chemical signature of the exhaust plume in a fraction of a second. In principle it was simple. In practice, it was technically difficult.
The earliest systems had to deal with weak optical signals, the challenge to apply spectroscopy on variable plume shapes, traffic interference, signal processing and the challenge of connecting an emissions measurement to a specific vehicle. They were also measuring a world that regulators were not yet fully prepared to use: emissions in motion, in open air, under uncontrolled conditions.
That is why the first decades of remote sensing were not just about building instruments. They were about proving that a roadside optical measurement could be scientifically valid, repeatable and useful for public policy.
2. The 1990s: The Validation Era
The 1990s were the decade in which remote sensing moved from university research into public-sector experimentation. In the United States, this transition was strongly influenced by the 1990 Clean Air Act Amendments and the subsequent EPA requirement that enhanced inspection and maintenance areas include a small amount of on-road testing. The 1992 federal rule required on-road testing of part of the vehicle fleet in enhanced I/M areas, and remote sensing quickly became the most obvious technology for doing this at scale.
California and Arizona were among the first U.S. jurisdictions to explore these applications through major pilot programs. California also established one of the early performance specifications for remote sensing systems, known as OREMS. The EPA then began issuing guidance for specific remote sensing applications: high-emitter identification in 1996, clean screening in 1998, and I/M program evaluation in 2002.
Colorado played a special role. The technology had been invented in Denver, and the state became an early proving ground for its practical use. A remote sensing study in Greeley, Colorado, helped provide the technical basis for EPA’s clean-screen guidance. This was one of the first demonstrations that roadside measurements could be used not only to find dirty vehicles, but also to identify very clean ones that did not need a full inspection.
By the end of the 1990s, remote sensing had survived its first major test: it had moved from a promising scientific idea to a technology that regulators were willing to consider seriously. The technology had been extensively tested and validated and it was clearly ready for mass adoption.
3. The 2000s: Expansion and Standardization
The 2000s were the decade of operational programs. The most important shift was from short-term research campaigns to continuous, programmatic use. Texas launched one of the first major high-emitter programs, using remote sensing to identify gross-polluting vehicles in metropolitan areas such as Dallas–Fort Worth, Houston and El Paso. The program was tied to broader inspection and maintenance policy, and it showed how roadside emissions data could become part of an enforcement and compliance system.
Missouri then launched the first large-scale commercial clean-screen program in 2000. Instead of requiring every vehicle to visit an inspection station, the program allowed very clean vehicles to be exempted from their next scheduled inspection. Colorado followed with its RapidScreen program, which collected millions of measurements per year and exempted a significant share of vehicles from dynamometer testing while maintaining overall program effectiveness.
This period also brought increasing standardization. Remote sensing programs had to define:
- valid measurement conditions,
- speed and acceleration criteria,
- vehicle-specific power ranges,
- calibration procedures,
- pollutant cutpoints for high-emitters,
- false-pass and false-fail controls,
- and data quality protocols.
These operational details mattered enormously. Remote sensing was no longer just a scientific instrument; it was becoming part of public administration.
Internationally, the technology also began to spread. China, Hong Kong and Korea started their high-emitter identification programs, while studies were conducted across Europe, Latin America, Oceania and other regions. By the end of the decade, remote sensing had already been used in more than 20 countries, with applications ranging from fleet characterizations to enforcement and policy evaluation.
The 2000s also saw the technology itself evolve a lot. Commercial systems expanded the number of pollutants measured, improved data processing and accuracy and integrated cameras, speed sensors, weather stations and large-scale databases. The field was becoming both more scientific and more operational.
4. The 2010s: Dieselgate and the Real-World Emissions Revolution
The 2010s changed the meaning of vehicle emissions control. For years, researchers had been documenting a gap between laboratory certification results and real-world emissions. Remote sensing was one of the tools that made this gap visible across large fleets. This was especially important for diesel NOx emissions, where real-world values were often far higher than expected from regulatory standards.
Then came Dieselgate.
The scandal revealed that some vehicles had been designed to perform differently under laboratory test conditions than under normal driving. Dieselgate was not only a story about defeat devices, it was a turning point in how regulators, researchers and the public understood vehicle emissions. Laboratory compliance was no longer enough. Real-world performance became central.
Remote sensing gained new relevance in this context because it offered something few other methods could provide: large-scale, non-intrusive, real-world evidence. It could measure hundreds of thousands of vehicles, compare vehicle families, identify suspicious groups and provide evidence for market surveillance.
Europe became one of the most important regions for this shift. Although Europe had used remote sensing for research since the 1990s on a much lesser ambition than the USA or major Asian economies, deployment accelerated after the Dieselgate. The CONOX project compiled remote sensing data from Switzerland, Sweden, the United Kingdom, France and Spain, creating a European database of more than 700,000 measurements and the TRUE Initiative launched campaigns to compile large datasets about real-world vehicle emissions performance.
Remote sensing was increasingly seen as a strategic technology for real-world compliance, urban policy and regulatory intelligence.
5. The 2020s: The Technological Leap and Mass Adoption
In the 2020s, vehicle emissions remote sensing is entering a new phase.
In recent years, there have been technological advances with significant implications. The accuracy and reliability of sensors have improved; new, much more advanced spectroscopy systems have been incorporated; systems have been developed that allow for 100% unmanned deployment and operation; and processing, communications and analytics capabilities have been integrated, taking the technology to a new level.
This is driving the expansion of the RSD and increasing confidence in its use. Portable systems are much more user-friendly and easier to operate; the sensors themselves can be permanently installed; external bottles are no longer needed to calibrate the instruments; and, ultimately, the technology has become much more reliable, affordable, and capable.
Thanks to this technological revolution, more and more countries have begun to adopt the technology. To date, 38 countries have implemented the technology, 20 of them in Europe.
In addition, high-emitter control programs are now incredibly well-established in places like the U.S., China, Hong Kong, India, and South Korea, having demonstrated decades of efficiency and excellent results as a complement to vehicle inspections.
Spain has published a technology-neutral standard, and Europe has published a legislative proposal for its mandatory implementation across the EU.
Fixed, portable, and semi-fixed systems are beginning to be deployed in various countries around the world for structural monitoring. Regulation of the technology is beginning to be replicated in other countries.
RSD systems are no longer isolated; they are gaining integration capabilities, including new sensors, new peripherals, and new computer vision capabilities. The ability to measure and analyze the condition of vehicles from the roadside is further enhanced, creating advanced, non-intrusive traffic monitoring systems. New applications such as connecting the RSD with police roadside inspections or variable tolling systems are new a reality.
The future of remote sensing will probably not be limited to enforcement. Its larger role may be as part of the environmental nervous system of road transport — a way to connect traffic, vehicles, air quality, climate policy and public health through real-world data and smart sensing systems.
This is the historical arc of vehicle emissions remote sensing: from a university experiment in Denver to a global technology for monitoring and controlling the real emissions of road transport.
1. Glossary
Aftertreatment system
Equipment installed in a vehicle to reduce emitted pollutants after combustion. Examples include catalytic converters, diesel particulate filters and selective catalytic reduction systems.
ALPR — Automatic License Plate Recognition
A camera-based technology that reads a vehicle’s license plate automatically. In remote sensing, ALPR links the emissions measurement to the correct license plate text from each vehicle record.
Carbon dioxide — CO₂
A gas produced by fuel combustion. In remote sensing, CO₂ is used as the reference gas because pollutants and CO₂ dilute together in the exhaust plume. CO₂ is primarily a greenhouse gas (GHG), not usually treated as an air pollutant.
Carbon monoxide — CO
A toxic gas produced by incomplete combustion. High CO emissions are often associated with poor engine tuning, malfunctioning emission controls or incomplete fuel combustion.
Clean screening
The use of remote sensing to identify vehicles with consistently low pollutant emissions. In some inspection programs, clean vehicles may be exempted from further testing or may be eligible for different benefits.
CO₂ ratio
A way of expressing vehicle emissions relative to carbon dioxide. Because exhaust plumes dilute quickly in open air, pollutant-to-CO₂ ratios provide a stable and meaningful measurement for vehicle emissions, compared to absolute concentrations.
Computer vision
A form of artificial intelligence that allows cameras to detect and interpret visual information. In remote sensing, it can identify vehicles, read license plates, estimate vehicle type and measure speed or acceleration.
Defeat device
A system or software strategy designed to reduce emissions during laboratory testing, but allow higher emissions during normal driving, or to disconnect aftertreatment systems to gain certain benefits (engine power, lower operational costs, etc.). Defeat devices became widely known after the Dieselgate scandal.
Dieselgate
The 2015 emissions scandal involving vehicles that performed differently in laboratory tests than on real roads. Dieselgate increased global attention on real-world emissions monitoring.
Distance-specific emissions
Emissions per distance travelled, expressed such as grams per kilometer (g/km). Remote sensing can estimate these values by combining pollutant ratios with vehicle characteristics and activity data.
Dynamometer.
A laboratory testing machine that allows a vehicle to be “driven” while remaining stationary. The vehicle’s wheels rotate on rollers, and the dynamometer simulates road resistance, speed changes and driving cycles. During the test, emissions are measured with laboratory instruments connected to the exhaust.
Emission factor
A value that expresses how much pollution is emitted per unit of activity, typically in g/km, considering in-use, real-world activity aggregates.
Exhaust plume
The cloud of gases and particles emitted from a vehicle’s tailpipe. Remote sensing measures this plume as the vehicle drives through the sensing beam.
Field audit
A routine check performed while the instrument is deployed in the field. Field audits verify that the system continues to operate within its required specifications.
Fleet characterization
The analysis of emissions across a large number of vehicles. Remote sensing is especially useful for understanding how emissions vary by vehicle age, fuel type, Euro standard, manufacturer, model or vehicle category.
Fuel-specific emissions
Emissions expressed per amount of fuel burned, commonly as grams per kilogram of fuel (g/kg or g/kg-fuel). This is a useful way to compare vehicles under different driving conditions. These values can be calculated from the emission ratios-to-CO2 if the fuel type is known.
High emitter
A vehicle that emits much more pollution than expected. High emitters may result from poor maintenance, tampering, failed aftertreatment systems or engine defects. The threshold used to classify a vehicle as a high emitter depends on the pollutant, the vehicle category and the rules or objectives of each program.
Hydrocarbons — HC
Unburned or partially burned fuel compounds emitted in vehicle exhaust. High HC emissions can indicate incomplete combustion or evaporative/emission-control problems.
Infrared spectroscopy — IR spectroscopy
A measurement technique that uses infrared light to detect gases such as CO, HC, CO₂ and NH₃.
Inspection and Maintenance — I/MA vehicle inspection program designed to identify vehicles that need repair or maintenance to reduce emissions. Remote sensing can support I/M programs by identifying high emitters or clean vehicles.
ISO 17025
An international standard for testing and calibration laboratories. Accreditation under ISO 17025 demonstrates that a laboratory or measurement body can produce technically valid results.
Limit of Detection — LoD
The lowest pollutant concentration that an instrument can reliably detect.
Low-emission zone — LEZ
An urban area where access may be restricted or regulated based on vehicle emissions performance. Remote sensing can help evaluate the real-world impact of such policies.
Market surveillance
The monitoring of vehicles already in use to verify whether they perform as expected under real-world conditions.
Nitric oxide — NO
A nitrogen oxide pollutant produced during combustion, especially at high temperatures. NO is an important component of vehicle NOx emissions.
Nitrogen dioxide — NO₂
A harmful air pollutant and part of the NOx family. NO₂ contributes to urban air pollution and the formation of secondary particulate matter.
Nitrogen oxides — NOx
A general term for NO and NO₂. NOx emissions are especially important for diesel vehicles and are closely linked to air quality, ozone formation and public health impacts.
Non-intrusive measurement
A measurement that does not require stopping the vehicle, contacting it, installing equipment on it or interfering with the driver.
OBD — On-Board Diagnostics
A vehicle’s built-in diagnostic system. It monitors the engine, emissions-control systems and other components, stores fault codes when problems are detected and may trigger a dashboard warning light. OBD is useful for maintenance and inspections, but it is a diagnostic tool rather than a direct measurement of tailpipe emissions.
Opacity
A measure of how much light is blocked or scattered by smoke or particles in the exhaust plume. Opacity-related methods can be used as indicators of particulate emissions.
Optical absorption spectroscopy
A technique that identifies gases by measuring how they absorb light at specific wavelengths.
Particulate matter — PM
Tiny solid or liquid particles emitted by combustion processes. In remote sensing, PM is usually estimated through optical smoke or opacity-related indicators rather than direct mass collection.
Particle number — PN
The number of particles present in a sample of air or exhaust. Some advanced roadside systems may include particle number measurement as an additional capability.
PEMS — Portable Emissions Measurement System
A mobile laboratory system installed on a vehicle to measure emissions during real driving. PEMS provides detailed second-by-second data for a small number of vehicles, while remote sensing provides large-scale measurements from many vehicles.
Plume dilution
The mixing of exhaust gases with ambient air after they leave the tailpipe. Remote sensing uses pollutant-to-CO₂ ratios to reduce the effect of plume dilution.
Pollutant-to-CO₂ ratio
The core remote sensing measurement. It compares each pollutant to CO₂ in the same exhaust plume, allowing meaningful measurements even as the plume mixes with air.
PTI — Periodic Technical Inspection
A scheduled vehicle inspection required in many countries. Remote sensing can complement PTI by identifying vehicles that may need additional inspection or repair.
Real Driving Emissions — RDE
Emissions measured while a vehicle is driven on real roads rather than only in a laboratory.
Real-world emissions
The pollutants vehicles actually emit during normal use on public roads. These emissions can differ from laboratory results because of driving conditions, vehicle aging, maintenance and real traffic behavior.
Remote Sensing Device — RSD
A roadside system that measures vehicle emissions remotely as vehicles pass through an optical sensing beam.
Selective Catalytic Reduction — SCR
An exhaust aftertreatment technology used mainly in diesel vehicles to reduce NOx emissions, often using ammonia or urea-based fluid.
Smoke Factor — SF
An optical indicator of smoke or particulate emissions, often normalized by fuel consumption. It should be interpreted as a fuel-specific smoke or particulate indicator, not as a direct laboratory-equivalent PM mass measurement.
Source Detector Module — SDM
The part of the remote sensing system that emits and detects the optical beam used to measure exhaust gases.
System Control Unit — SCU
The processing and communications unit of the remote sensing system. It integrates emissions data, vehicle data, camera data, environmental readings and communications.
Type approval
The official certification process used to confirm that a vehicle model complies with regulatory requirements before being sold.
Ultraviolet spectroscopy — UV spectroscopy
A measurement technique that uses ultraviolet light to detect pollutants such as NO and NO₂ and to support smoke or particulate-related measurements.
Vehicle Specific Power — VSP
An estimate of the power demand on a vehicle based on speed, acceleration, road grade and vehicle characteristics. VSP helps interpret emissions under different driving conditions.
2.Key Scientific Papers
Bishop, G.A., Starkey, J.R., Ihlenfeldt, A., Williams, W.J., & Stedman, D.H. (1989). “IR Long-Path Photometry: A Remote Sensing Tool for Automobile Emissions.” Analytical Chemistry, 61(10), 671A–677A. DOI: 10.1021/ac00185a002.
Guenther, P.L., Bishop, G.A., Peterson, J.E., & Stedman, D.H. (1994). “Emissions from 200,000 Vehicles: A Remote Sensing Study.” Science of the Total Environment, 146/147, 297–302. DOI: 10.1016/0048-9697(94)90249-6.
Zhang, Y., Stedman, D.H., Bishop, G.A., Guenther, P.L., & McVey, I.F. (1995). “Worldwide On-Road Vehicle Exhaust Emissions Study by Remote Sensing.” Environmental Science & Technology, 29, 2286–2294. DOI: 10.1021/es00009a020.
Beaton, S.P., Bishop, G.A., Zhang, Y., Stedman, D.H., Ashbaugh, L.L., & Lawson, D.R. (1995). “On-Road Vehicle Emissions: Regulations, Costs, and Benefits.” Science, 268(5213), 991–993. DOI: 10.1126/science.268.5213.991.
Bishop, G.A., Stedman, D.H., & Ashbaugh, L. (1996). “Motor Vehicle Emissions Variability.” Journal of the Air & Waste Management Association, 46, 667–675. DOI: 10.1080/10473289.1996.10467501.
Bishop, G.A., Stedman, D.H., De La Garza Castro, J., & Davlos, F.J. (1997). “On-Road Remote Sensing of Vehicle Emissions in Mexico.” Environmental Science & Technology, 31(12), 3505–3510.
Popp, P.J., Bishop, G.A., & Stedman, D.H. (1999). “Development of a High-Speed Ultraviolet Spectrometer for Remote Sensing of Mobile Source Nitric Oxide Emissions.”
Carslaw, D.C., & Rhys-Tyler, G. (2013). “New insights from comprehensive on-road measurements of NOx, NO2 and NH3 from vehicle emission remote sensing in London, UK.” Atmospheric Environment, 81, 339–347. DOI: 10.1016/j.atmosenv.2013.09.026.
Pujadas, M., Domínguez-Sáez, A., & De la Fuente, J. (2017). “Real-driving emissions of circulating Spanish car fleet in 2015 using RSD Technology.” Science of the Total Environment, 576, 193–209. DOI: 10.1016/j.scitotenv.2016.10.049.
Huang, Y., Organ, B., Zhou, J.L., Surawski, N.C., Hong, G., Chan, E.F.C., & Yam, Y.S. (2018). “Remote sensing of on-road vehicle emissions: Mechanism, applications and a case study from Hong Kong.” Atmospheric Environment, 182, 58–74. DOI: 10.1016/j.atmosenv.2018.03.035.
Borken-Kleefeld, J., & Dallmann, T. (2018). “Remote sensing of motor vehicle exhaust emissions.” ICCT White Paper.
Bernard, Y., Tietge, U., German, J., & Muncrief, R. (2018). “Determination of real-world emissions from passenger vehicles using remote sensing data.” TRUE / ICCT.
Sjödin, Å., Cha, Y., Zhang, S., Wang, H., Wang, D., Wu, Y., Plogmann, J., Dimopoulos Eggenschwiler, P., Pettinen, R., & Siersbæk, S.D. (2024). “Remote Emission Sensing as a means of detection and enforcement of gross-polluting vehicles.” IEA-AMF TCP Task 61.
Huang, Y., Lee, C.K.C., Yam, Y.S., Mok, W.C., Zhou, J.L., Zhuang, Y., Surawski, N.C., Organ, B., & Chan, E.F.C. (2022). “Rapid detection of high-emitting vehicles by on-road remote sensing technology improves urban air quality.” Science Advances, 8(5), eabl7575.
3.Standards and Regulations
The following list shows some of the most important standards and regulations.
- UNE 82509:2026, Remote vehicle emission measurement instruments – Metrology, requirements and tests, January 2026, https://www.une.org/encuentra-tu-norma/busca-tu-norma/norma/?c=N0075735
- Directive 2014/47/EU of the European Parliament and of the Council, https://eur-lex.europa.eu/eli/dir/2014/47/oj/eng
- US EPA-420-B-20-020, March 2020; https://www.epa.gov/state-and-local-transportation/vehicle-emissions-inspection-and-maintenance-im-policy-and-technical
- US Generation 2 Colorado On-Road Vehicle Emissions Remote Sensing (Gen2covers) Specifications, August 2021, https://cdphe.colorado.gov/motor-vehicle-emissions/emissions-inspections-for-gasoline-powered-vehicles
- US California – H&S 44080 – HighEmitterRegulation, https://codes.findlaw.com/ca/health-and-safety-code/hsc-sect-44080/
- US California – HSC 44011 – CleanScreeningRegulation, https://law.justia.com/codes/california/code-hsc/division-26/part-5/chapter-5/article-2/section-44011/
- US Virginia – 46.2-1178.1 – OnRoadTestingRegulation, https://law.lis.virginia.gov/vacode/title46.2/chapter10/section46.2-1178.1/
- US Virginia – 9VAC5-91-750 – HighEmitterRegulation, https://law.lis.virginia.gov/admincode/title9/agency5/chapter91/section750/
- US Virginia – 9VAC5-91-740 – CleanScreeningRegulation, https://law.lis.virginia.gov/admincode/title9/agency5/chapter91/section740/